We use cookies to improve your experience on our site, analyze site traffic, and assist in our marketing efforts. By clicking "Accept all," you agree to the storing of cookies on your device. You can choose to "Reject all" non-essential cookies. For more information, please read our Cookie Policy.
UK House Prices September 2026: Latest RICS, Halifax and Nationwide Data
September 2026 briefing on UK house prices: Nationwide, the rebranded Lloyds (Halifax) index and the RICS survey, plus ONS UK HPI timing, Bank of England context and regional highlights for London, the North West and Scotland.
A £275,465 average house price that barely moved in a month is not a headline most people expect in a housing market briefing, yet that is exactly the story dominating UK house prices in September 2026. Behind the modest numbers lies a tug-of-war between cautious buyers, stretched affordability, and a mortgage market still adjusting to Bank of England policy. This briefing pulls together the newest figures from Nationwide, the rebranded Lloyds (formerly Halifax) index, the RICS Residential Market Survey, and official ONS data to give buyers, sellers and surveyors a clear read on where the market actually stands this month.
UK housing market briefing, September 2026.
Key takeaways
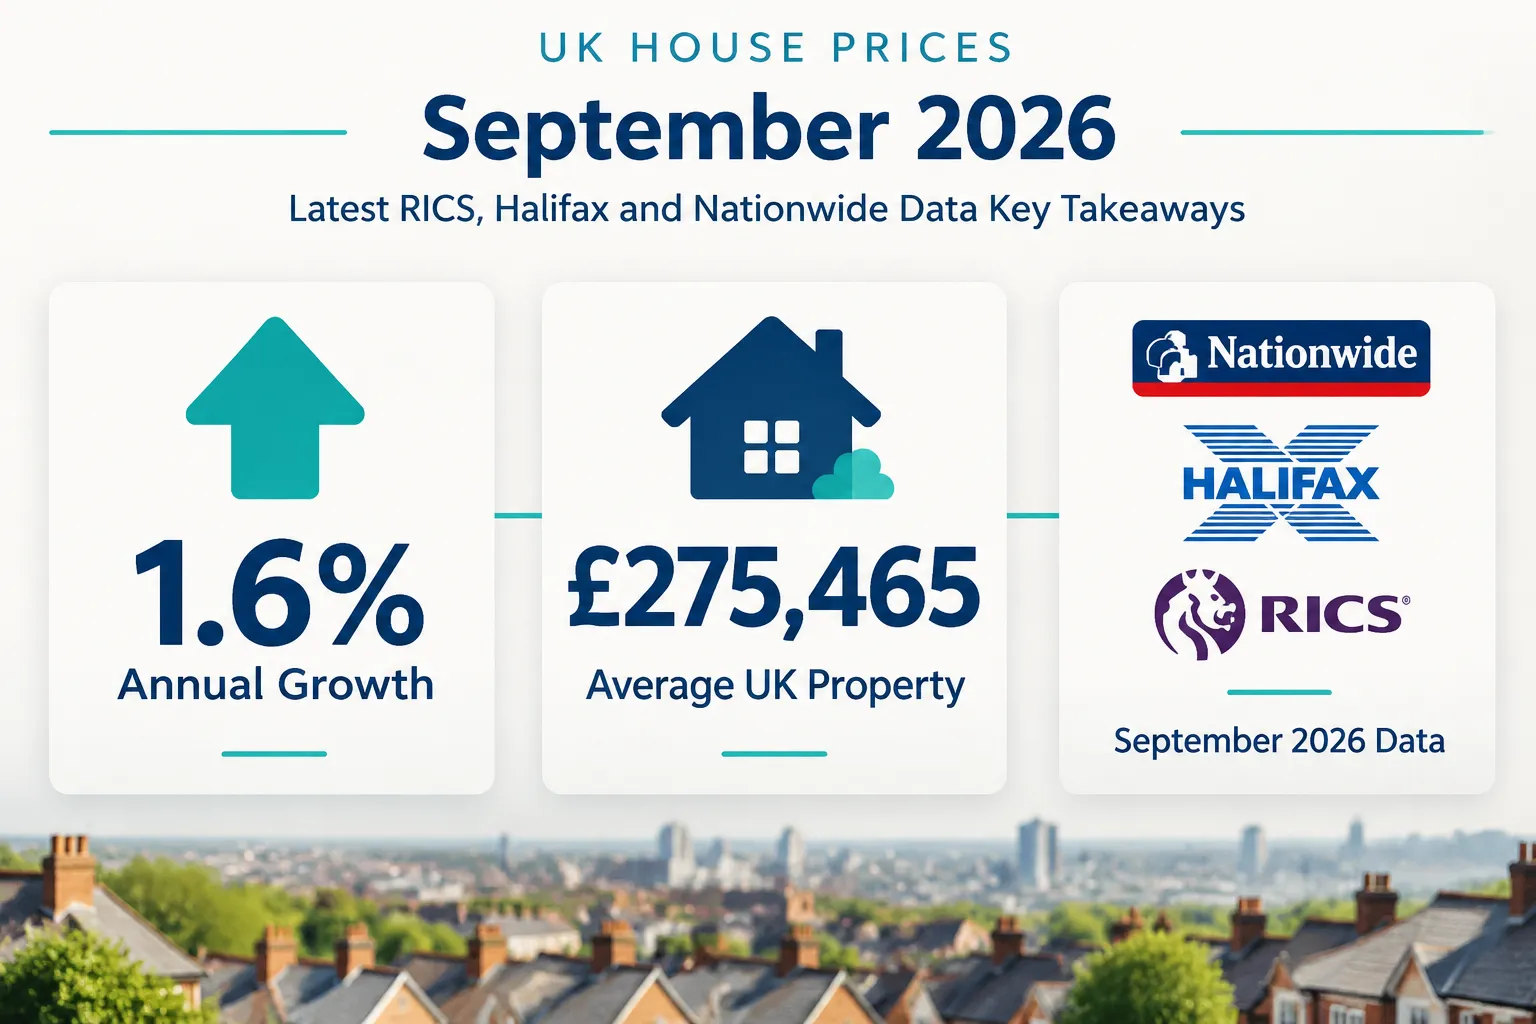
Nationwide's August 2026 index shows annual UK house price growth of 1.6%, with the average property now costing £275,465 — the first monthly rise since April 2026.
The Halifax index, now published as the Lloyds House Price Index, shows near-zero monthly movement and annual growth of roughly 0.1%, pointing to a stagnant rather than falling market.
RICS surveyors report new buyer enquiries and agreed sales both deeply negative (around -28% and -30%), but seller instructions have improved sharply, hinting at returning supply.
The July 2026 ONS UK House Price Index is not due until 16 September 2026, so the most recent official Land Registry-based figure available remains June 2026.
London asking prices are falling faster than the national average, while the North West and Scotland show comparatively firmer conditions.
Nationwide's August 2026 index: a fragile return to growth
Nationwide's building society index, published on 1 September 2026, is the freshest lender snapshot for September's briefing. It recorded annual growth of 1.6% year-on-year, keeping the pace of price rises broadly stable rather than accelerating. The average UK house price now stands at approximately £275,465, and on a seasonally adjusted basis prices rose 0.2% month-on-month — the first monthly increase since April 2026.
That 0.2% uptick surprised some economists, who had pencilled in just a 0.1% rise, and commentators suggested it signals demand holding up better than the wider economic backdrop might imply. On a raw, non-seasonally-adjusted basis, however, August's average price actually dipped around 0.4% from July, which underscores that this remains a flat market rather than a genuine upswing.
Lloyds (Halifax) House Price Index: near-stagnant values
One of the most notable administrative changes this year is that the long-running Halifax House Price Index has been rebranded as the Lloyds House Price Index from the July 2026 release onwards. Lloyds has been explicit that the underlying methodology and data series are unchanged, so historical comparisons remain valid — this is a naming change, not a break in the data.
The latest Lloyds figures put the average UK house price at around £299,253 in July 2026, essentially flat against June's £299,330. That represents a fractional monthly decline and annual growth of only around 0.1%. Economic-calendar tracking of the August reading points to 0.0% month-on-month movement and similarly low annual growth, reinforcing a picture of near-stagnation rather than either a correction or a rally.
The gap between Nationwide's roughly £275,000 average and Lloyds' roughly £299,000 average reflects methodological differences in how each lender weights property types and regions, not a sudden divergence in the market itself.
The RICS Residential Market Survey for July 2026 offers the clearest sentiment-based view. Surveyors reported new buyer enquiries at a net balance of around -28%, agreed sales at -30%, and a national price balance of roughly -30% — all confirming that more chartered surveyors are seeing falls than rises across enquiries, sales and prices.
There is, however, a genuinely encouraging thread. New seller instructions improved from around -23% in June to just -4% in July, meaning the flow of homes coming onto the market has almost stopped shrinking. Three-month price expectations remain weak at around -31%, yet 12-month price expectations turn modestly positive at roughly +4% to +8% — surveyors expect a soft autumn but a slightly firmer market by late 2027.
ONS UK House Price Index and the official data timeline
Anyone relying purely on official statistics needs to understand a timing quirk this month. The July 2026 UK HPI is due for publication on 16 September 2026. That means, as of early September, the most recent fully published Land Registry-based figure is still June 2026 — a reminder that ONS data always lags lender and survey-based indices by six to eight weeks.
Mortgage rates and Bank of England base rate context
Mortgage pricing continues to shape affordability more than headline price indices alone. With the Bank of England's base rate remaining a central reference point for lenders, fixed-rate mortgage deals have stayed within a narrow band through the summer, keeping monthly repayments high relative to average earnings. This affordability squeeze helps explain why RICS enquiry and sales balances remain negative even as seller instructions recover — buyers are present, but many are constrained by what they can borrow.
Regional highlights: London, North West and Scotland
London: Rightmove's August 2026 asking price data shows the capital's average newly listed price at around £646,451, down 4.4% month-on-month and 3.1% year-on-year — one of the steepest regional pullbacks in the country.
North West England: Conditions have generally held up better than the London market, with smaller asking-price movements and comparatively steady buyer interest.
Scotland: Scottish house prices have shown relative resilience through 2026, benefiting from lower average price points and a different mortgage-affordability dynamic.
Nationally, Rightmove's August 2026 data shows the average newly listed asking price at approximately £364,999, down 2.0% month-on-month and 1.0% year-on-year — described as the largest August price drop since 2018.
What this means for buyers, sellers and surveyors
For buyers, the flat-to-slightly-positive lender data combined with improving seller instructions suggests more choice is emerging, even if mortgage costs remain a constraint. For sellers, realistic pricing is essential — Rightmove's data shows homes priced too optimistically are sitting longer, particularly in London. For surveyors and agents, the RICS gap between negative near-term expectations and positive 12-month expectations is worth communicating clearly to clients weighing whether to transact now or wait.
Frequently asked questions
Is the UK housing market falling in September 2026?
Not sharply. Nationwide's August index shows a small annual rise of 1.6%, while Lloyds' data shows near-zero movement. The market is best described as flat rather than falling.
Why has Halifax changed its name?
Halifax's house price index has been rebranded as the Lloyds House Price Index from the July 2026 release, though Lloyds confirms the methodology and data series are unchanged.
When is the next official ONS house price figure due?
The July 2026 UK HPI is scheduled for publication on 16 September 2026, meaning June 2026 remains the latest confirmed official figure until then.
What does the RICS survey say about future prices?
Three-month expectations are weak, around -31%, but 12-month expectations are modestly positive at roughly +4% to +8%, suggesting surveyors expect gradual improvement into 2027.
Which UK region is seeing the biggest price falls?
London, where Rightmove data shows average asking prices down 4.4% month-on-month and 3.1% year-on-year in August 2026, well ahead of the national decline.
Conclusion
Taken together, this month's data paints a UK housing market defined by stability rather than momentum in either direction. Nationwide's modest 0.2% monthly rise, Lloyds' near-flat readings and RICS's mixed sentiment all point to a market absorbing higher borrowing costs without a sharp correction. Watch the 16 September ONS release and October's RICS survey closely — both will clarify whether autumn 2026 brings the modest recovery forward-looking indicators currently suggest.